Horizontal Bar Chart with X-Axis Custom Renderer
I decided to write an post about Charts Library,
Specifically about how to create a x-axis custom renderer for horizontal bar chart. If we implement
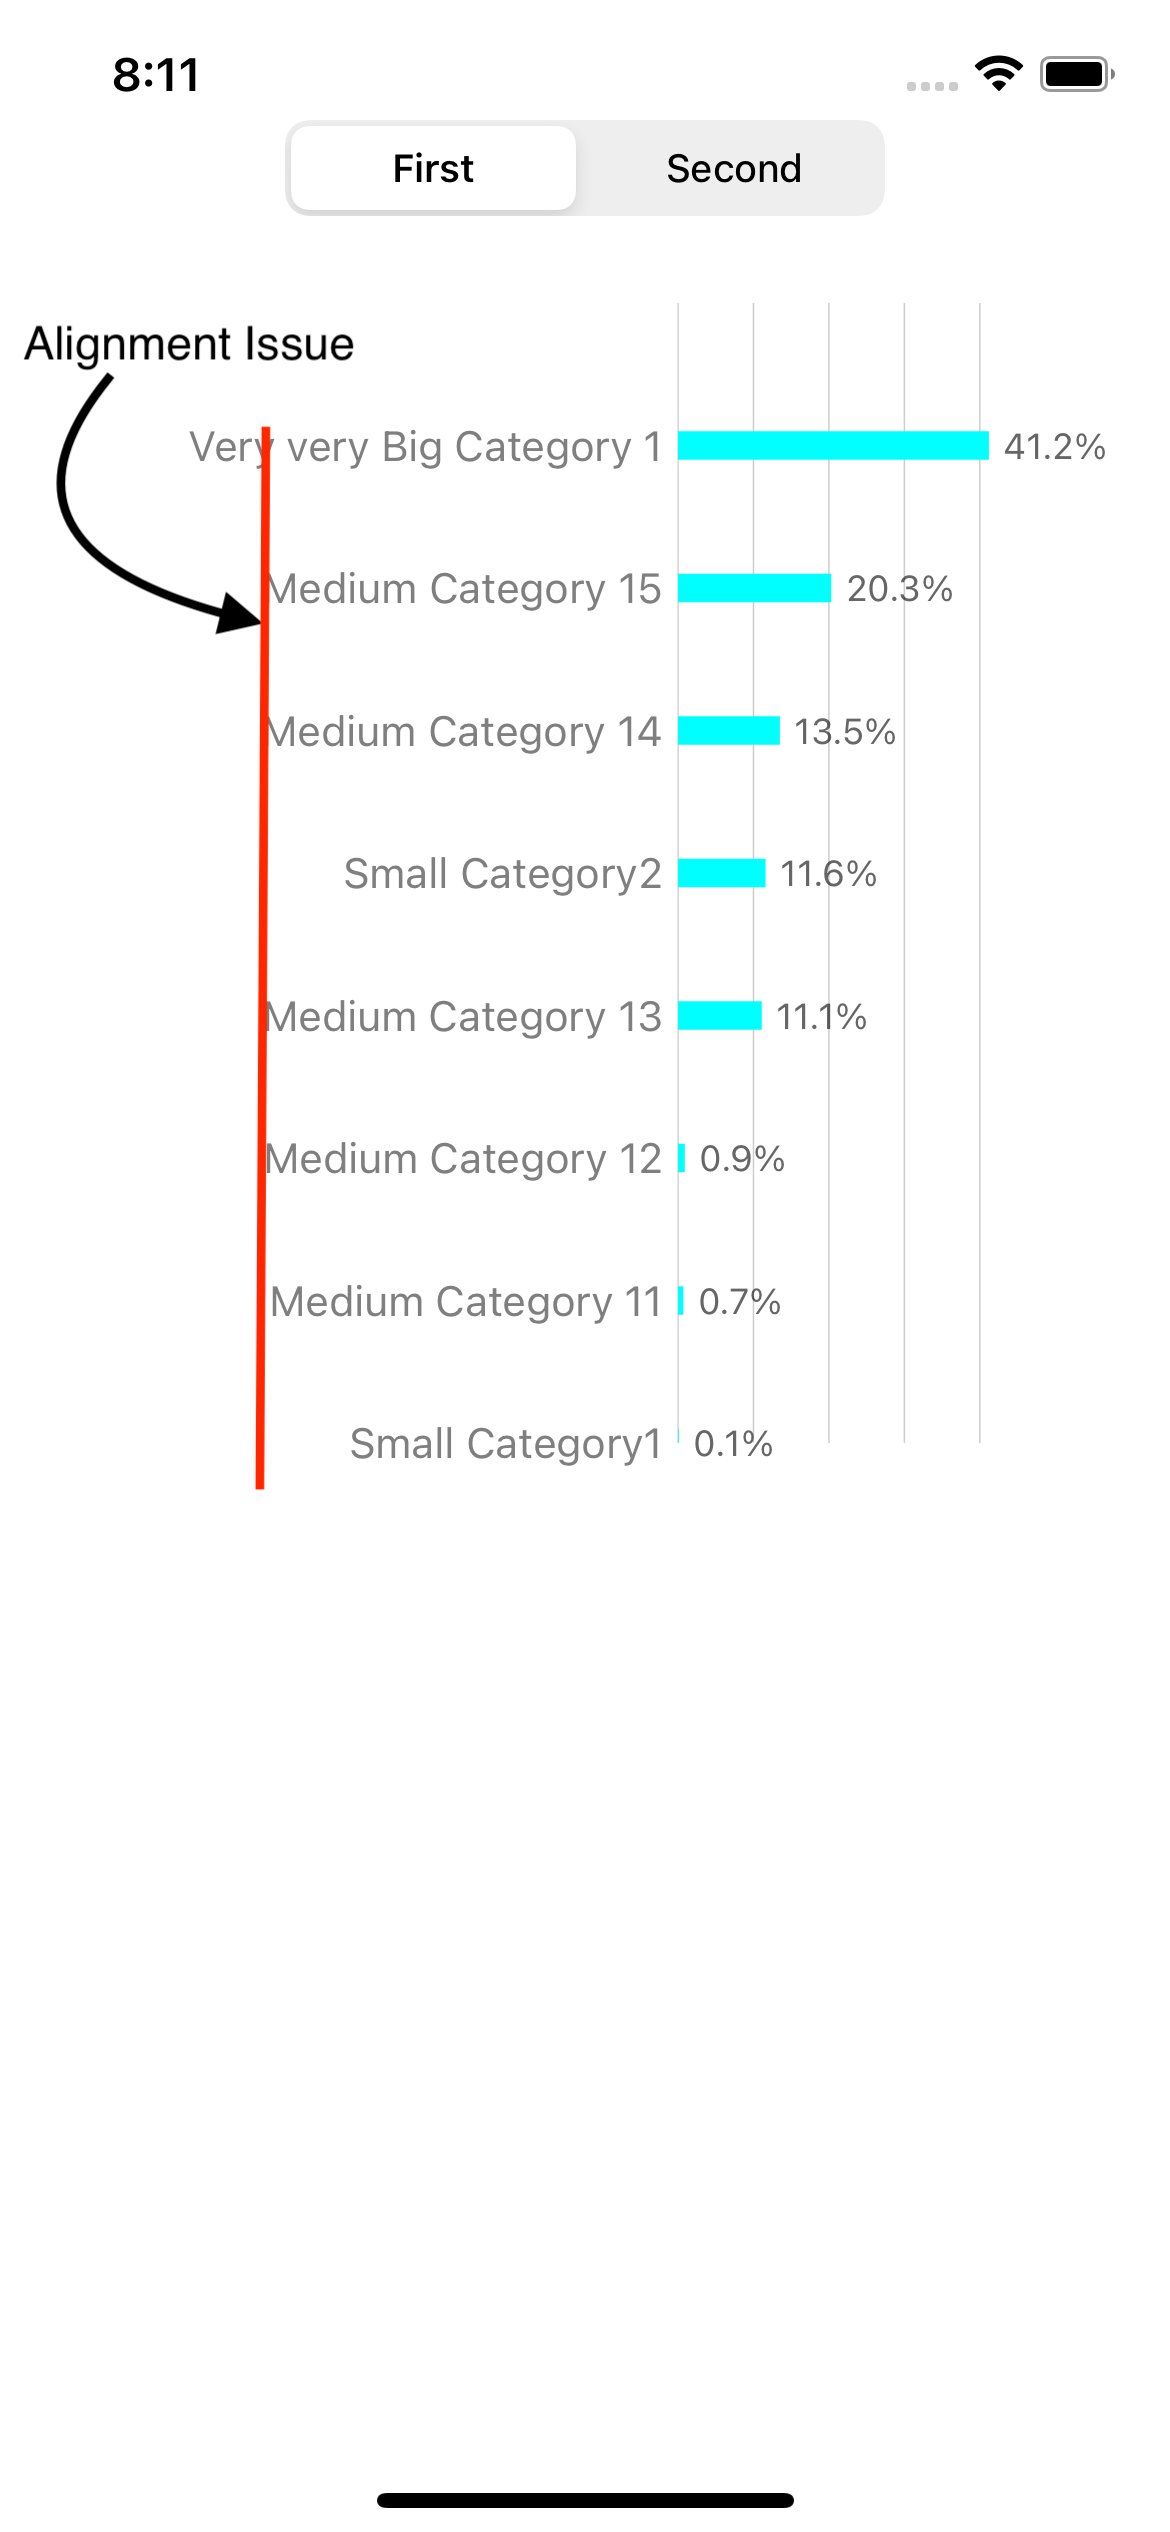
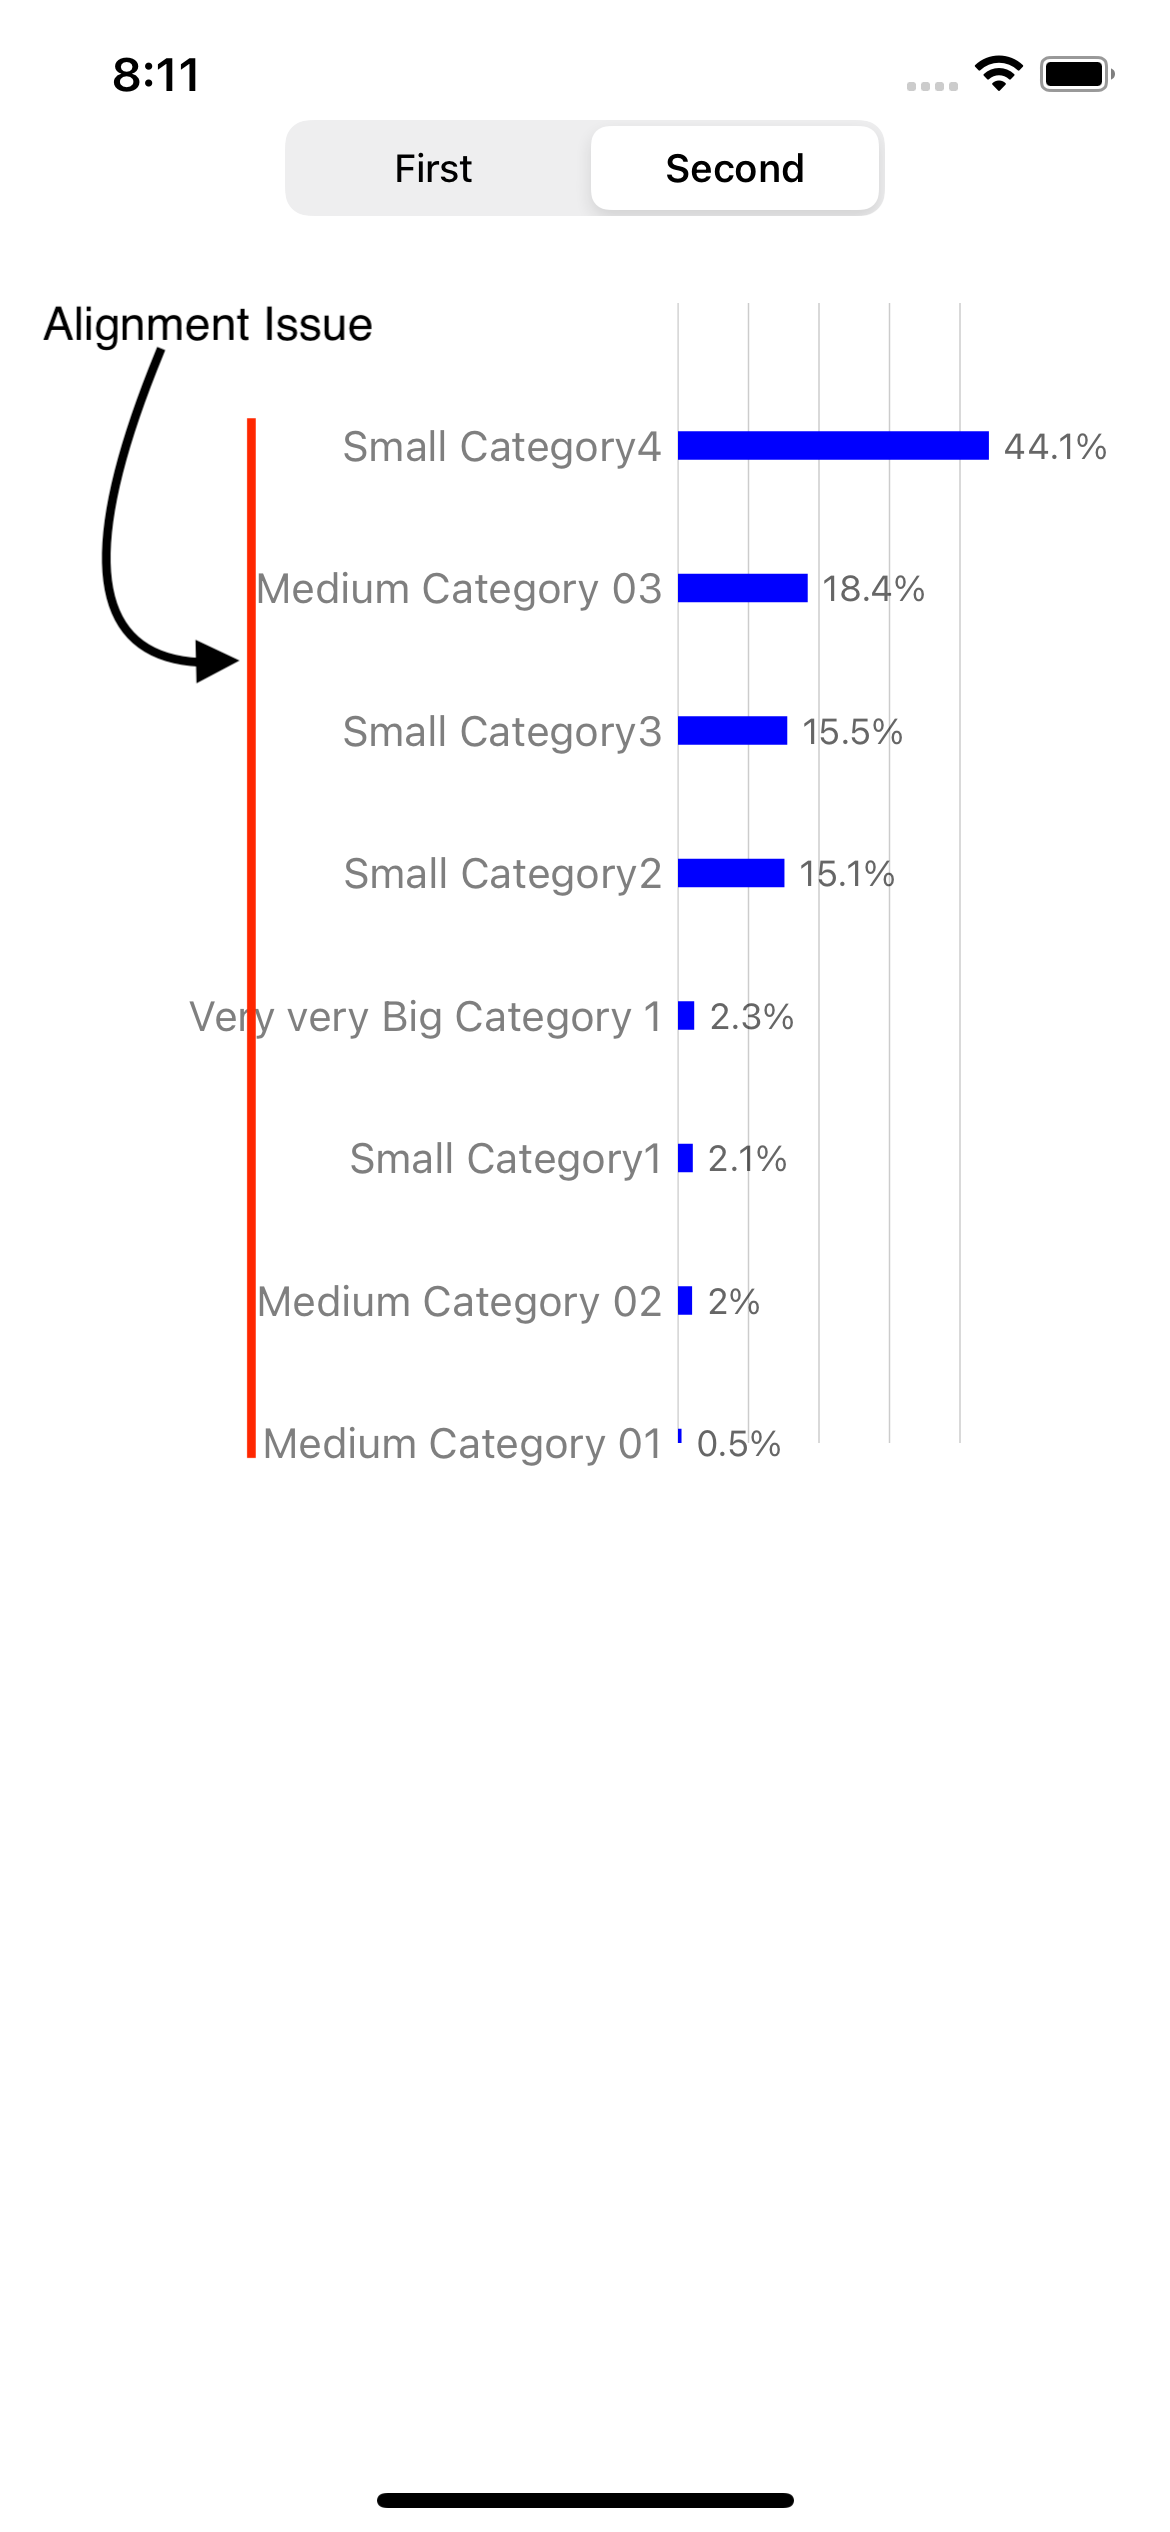
horizontal bar chart without x-axis custom renderer, Alignment Issue shown in Actual Result will be observed.
Inorder to resolve this alignment issue, we need to use x-axis custom renderer
(Refer Expected Result for screenshots after using x-axis custom renderer).
Actual Result :
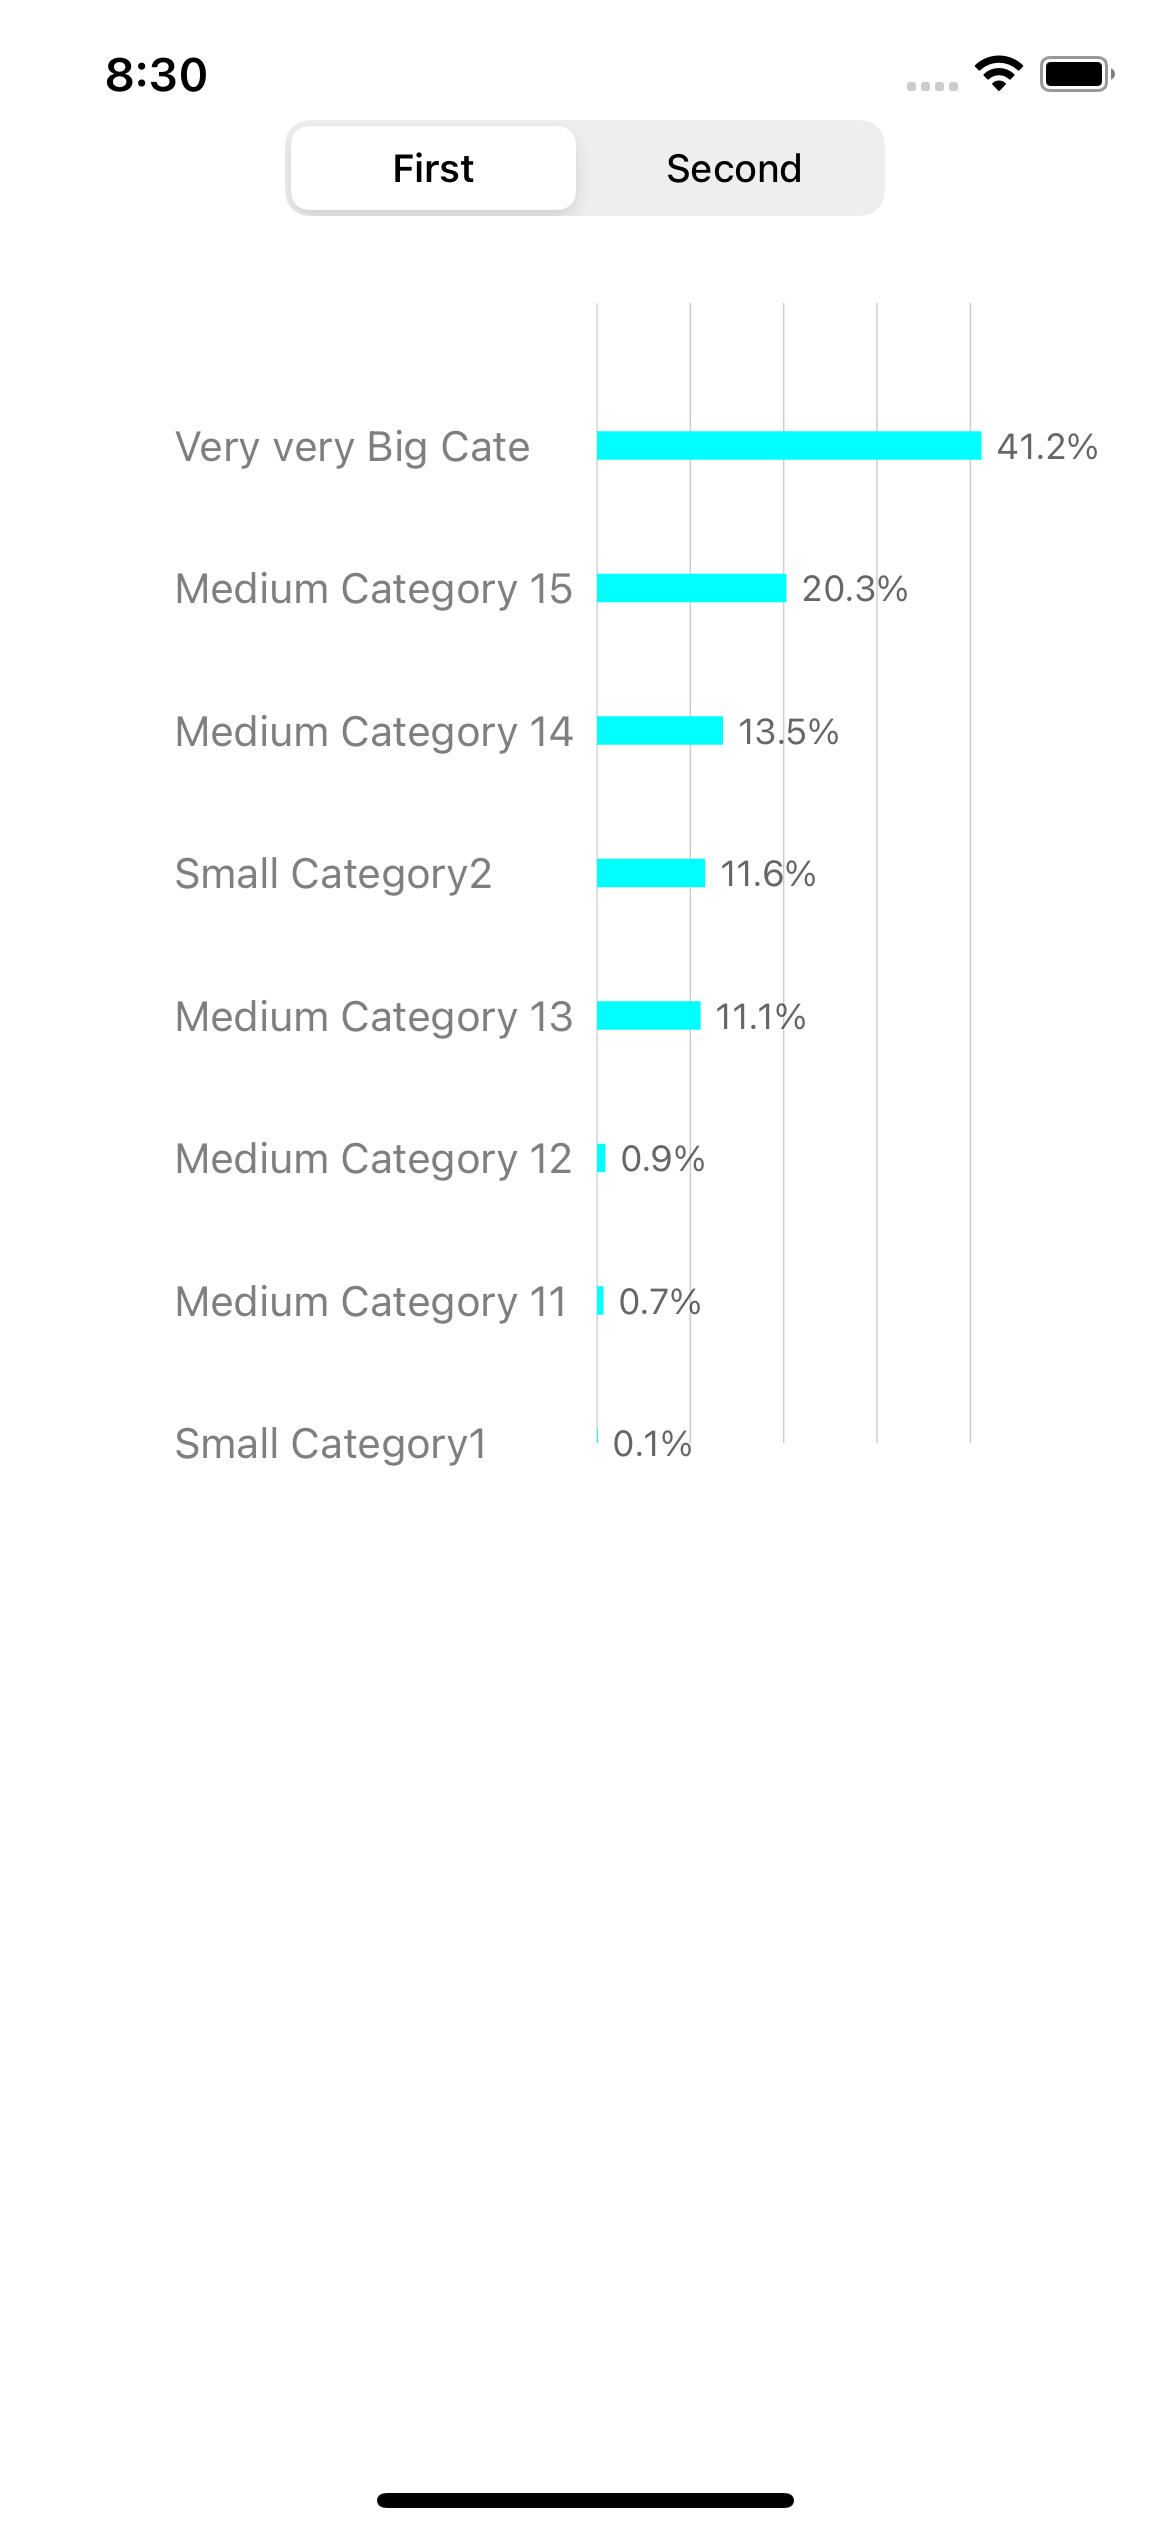
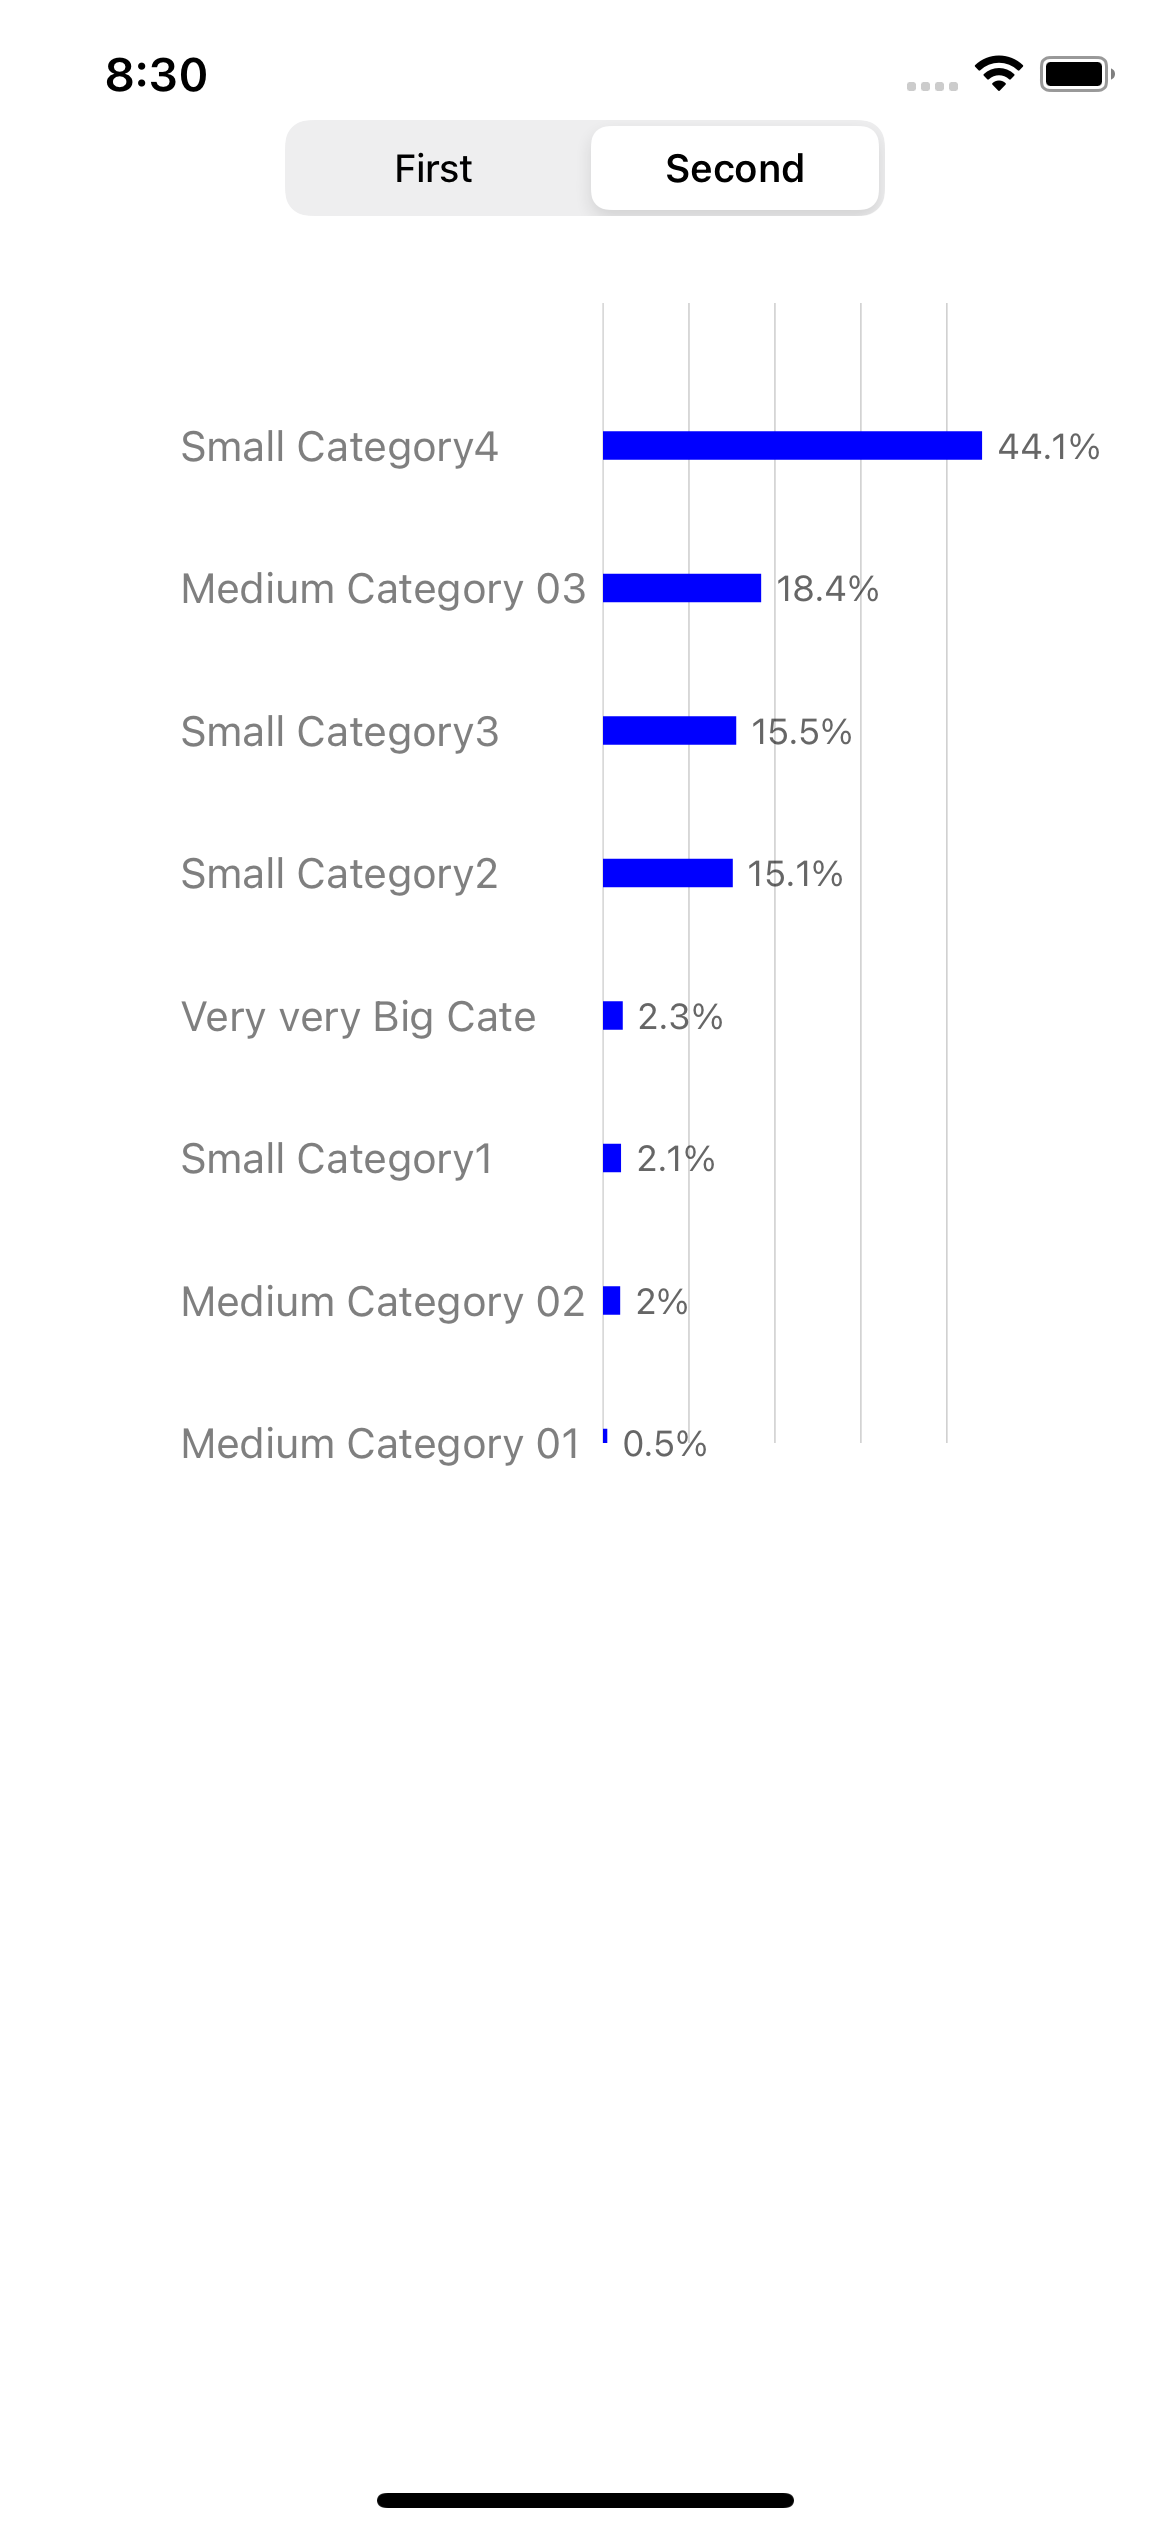
Expected Result :
Assuming you have already installed Charts Library by adding to Podfile of your project and imported Charts to required UIViewConntroller.
Let’s start by creating required categories and associated values for both segments i.e. First & Second.
    let unitsSold = [0.1, 0.7, 0.9, 11.1, 11.6, 13.5, 20.3, 41.2]
    let unitsSold2 = [0.5, 2.0, 2.1, 2.3, 15.1, 15.5, 18.4, 44.1]
    let singleLineCategory1 = ["Small Category1", "Medium Category 11", "Medium Category 12", "Medium Category 13", "Small Category2", "Medium Category 14", "Medium Category 15", "Very very Big Category 1"]
    let singleLineCategory2 = ["Medium Category 01", "Medium Category 02", "Small Category1", "Very very Big Category 1", "Small Category2", "Small Category3", "Medium Category 03", "Small Category4"]
Next we need to create and connect IBOutlets of HorizontalBarChartView and UISegmentedControl.
Also, Update viewDidLoad() method with target for segmentControl:
    @IBOutlet var hBarChartView: HorizontalBarChartView!
    @IBOutlet var segmentControl: UISegmentedControl!

    override func viewDidLoad() {
        super.viewDidLoad()
        // Do any additional setup after loading the view.
        segmentControl.addTarget(self, action: #selector(segmentedControlDidChange(_:)), for: .valueChanged)
    }
Now, create setupGraphSettings() method to define required graph Configurations/Settings (they are self-explanatory):
    func setupGraphSettings() {
        hBarChartView.extraLeftOffset = 30.0
        hBarChartView.extraTopOffset = 0.0
        hBarChartView.extraBottomOffset = 0.0
        hBarChartView.extraRightOffset = 30.0


        hBarChartView.pinchZoomEnabled = false
        hBarChartView.doubleTapToZoomEnabled = false
        hBarChartView.scaleXEnabled = false
        hBarChartView.scaleYEnabled = false

        // Graph Config
        hBarChartView.legend.enabled = false
        let xAxis = hBarChartView.xAxis
        xAxis.enabled = true
        xAxis.labelPosition = .bottom
        xAxis.drawAxisLineEnabled = false
        xAxis.drawGridLinesEnabled = false
        xAxis.drawLabelsEnabled = true

        xAxis.axisMinimum = 0
        xAxis.axisMaximum = 8
        xAxis.granularityEnabled = true
        xAxis.granularity = 1

        let leftAxis = hBarChartView.leftAxis
        leftAxis.enabled = true
        leftAxis.drawLabelsEnabled = false
        leftAxis.axisMinimum = 0

        hBarChartView.rightAxis.enabled = false

        // Graph Color & Font settings
        hBarChartView.backgroundColor = .white
        leftAxis.zeroLineColor = UIColor.clear
        leftAxis.axisLineColor = UIColor.clear
        leftAxis.gridColor = UIColor.black.withAlphaComponent(0.2)
        xAxis.labelFont = UIFont.systemFont(ofSize: 14)
        xAxis.labelTextColor = UIColor.black.withAlphaComponent(0.5)

    }
We need to create 2 helper method dataSetWith() to create BarChartDataSet and setupPercentValueFormatter for formatting values with “%” suffix:
    func dataSetWith(entries: [BarChartDataEntry],
                     colors: [UIColor] = [.black],
                     highlightColor: UIColor,
                     label: String = "") -> BarChartDataSet {

        let barDataSet = BarChartDataSet(entries: entries, label: label)
        barDataSet.valueFont = UIFont.systemFont(ofSize: 14)
        barDataSet.drawValuesEnabled = true
        barDataSet.colors = colors
        barDataSet.highlightColor = highlightColor

        return barDataSet
    }
    func setupPercentValueFormatter(barData : BarChartData) {
        let percentAxisFormatter = NumberFormatter()
        percentAxisFormatter.numberStyle = .decimal
        percentAxisFormatter.positiveSuffix  = "%"
        percentAxisFormatter.maximumFractionDigits = 2
        barData.setValueFormatter(DefaultValueFormatter(formatter: percentAxisFormatter))

        barData.setValueFont(UIFont.systemFont(ofSize: 12))
        barData.setValueTextColor(UIColor.black.withAlphaComponent(0.6))
    }
Now we are ready to create methods for updating Chart data based on selected UISegmentControl.
We have 2 Segments, namely First & Second. When user taps on First segment setDataForSegmentFirst()
method will be executed and When user taps on Second segment setDataForSegmentSecond() method will be executed.
We start by resetting chart data i.e. hBarChartView.data = nil in each of these methods and use singleLineCategory1 categories in case of First &
singleLineCategory2 categories in case of Second to format X-axis values of Chart. Next we create arrEntries for Chart entries and
append unitsSold values for First segment & unitsSold2 for Second segment.
After creating BarChartData from BarChartDataSet we notify ChartView of data modification with hBarChartView.data?.notifyDataChanged():
Note : This is horizontal bar chart so X-axis are configured to bottom. You can change xAxis.labelPosition = .bottom
within setupGraphSettings() method to configure position as per your needs.
    func setDataForSegmentFirst() {
        hBarChartView.data = nil
        hBarChartView.xAxis.valueFormatter = IndexAxisValueFormatter(values: singleLineCategory1)


        var arrEntries = [BarChartDataEntry]()

        for interval in 0..<unitsSold.count {
            arrEntries.append(BarChartDataEntry(x: Double(interval), y: Double(unitsSold[interval])))
        }

        let arrarDataSet = dataSetWith(entries: arrEntries,
                                            colors: [UIColor.cyan],
                                             highlightColor: UIColor.black,
                                             label: "label1")

        let barData = BarChartData(dataSet: arrarDataSet)
        setupPercentValueFormatter(barData: barData)
        barData.barWidth = 0.2
        hBarChartView.data = barData

        hBarChartView.data?.notifyDataChanged()
    }
    func setDataForSegmentSecond() {
        hBarChartView.data = nil
        hBarChartView.xAxis.valueFormatter = IndexAxisValueFormatter(values: singleLineCategory2)

        var arrEntries = [BarChartDataEntry]()

        for interval in 0..<unitsSold2.count {
            arrEntries.append(BarChartDataEntry(x: Double(interval), y: Double(unitsSold2[interval])))
        }

        let arrarDataSet = dataSetWith(entries: arrEntries,
                                            colors: [UIColor.blue],
                                             highlightColor: UIColor.black,
                                             label: "label2")

        let barData = BarChartData(dataSet: arrarDataSet)
        setupPercentValueFormatter(barData: barData)
        barData.barWidth = 0.2
        hBarChartView.data = barData

        hBarChartView.data?.notifyDataChanged()
    }
Next, We create setupChart() method which will inturn setup Graph with required Configurations/Settings
as well as update Horizontal bar chart with data for First i.e. default Segment. Also we need to update viewDidLoad() by adding setupChart() method
so that on intialisation itself Horizontal Bar chart is first configured with required settings & then loaded with data of First segment.
    func setupChart() {
        setupGraphSettings()
        setDataForSegmentFirst()
    }

    @objc func segmentedControlDidChange(_ sender:UISegmentedControl) {
        let index = sender.selectedSegmentIndex
        switch index {
        case 0:
            setDataForSegmentFirst()
        default:
            setDataForSegmentSecond()
        }
    }
    override func viewDidLoad() {
        super.viewDidLoad()
        // Do any additional setup after loading the view.
        segmentControl.addTarget(self, action: #selector(segmentedControlDidChange(_:)), for: .valueChanged)
        setupChart()
    }
If you compile the code and run you will observe the alignment issue mentioned at the start of this post (Refer ‘Actual Result’ for screenshots). Now, lets amend the code to use Renderer so that we can get the expected result.
Inorder to create CustomHorizontalXAxisRenderer we need to first jump to the definition of XAxisRendererHorizontalBarChart for drawLabels method.
Next create a new class of CustomHorizontalXAxisRenderer which inherits from XAxisRendererHorizontalBarChart so we can override the behaviour of how labels are drawn.
Lastly update the logic by adding following three lines before drawLabel call : -
    let maxWidth:CGFloat = 136// Update as per your needs
    let actualSize = label.size(withAttributes: [.font: xAxis.labelFont])
    let newPositionX = pos - (maxWidth - actualSize.width)
Add below line to setupGraphSettings() method to start using the custom renderer.
    hBarChartView.xAxisRenderer = CustomHorizontalXAxisRenderer(
        viewPortHandler:hBarChartView.viewPortHandler,
        xAxis: xAxis,
        transformer:hBarChartView.getTransformer(forAxis: .left),
        chart: hBarChartView)
That’s it. Compile the code you will observe the expected behaviour in simulator. (Refer ‘Expected Result’ for screenshots)
Hope above post was informative and useful. You can check the source code on github : HERE