Pagination with Line Chart
In this post we will look into one of the easiest approach for implementing pagination with line chart.
(Refer Final Result for screenshots). Assuming you have already installed
Charts Library by adding to Podfile of your project and imported Charts to required UIViewController.
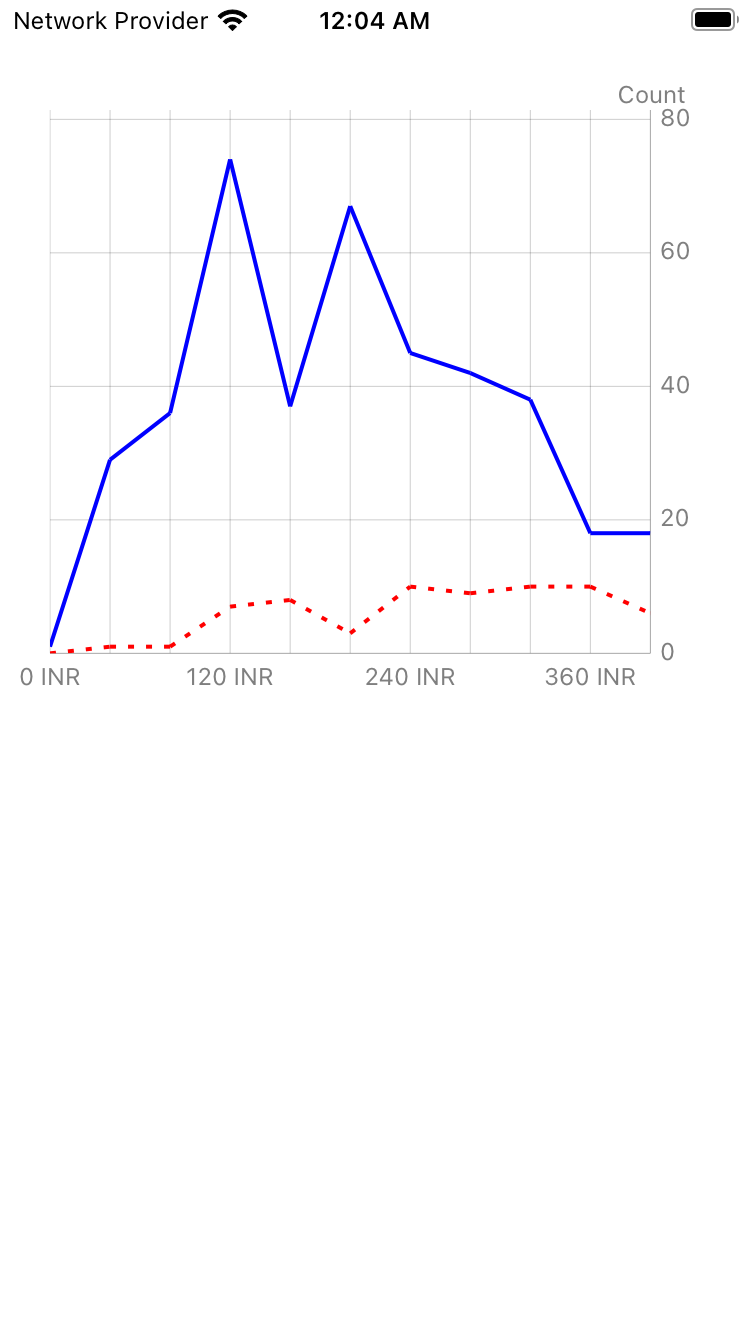
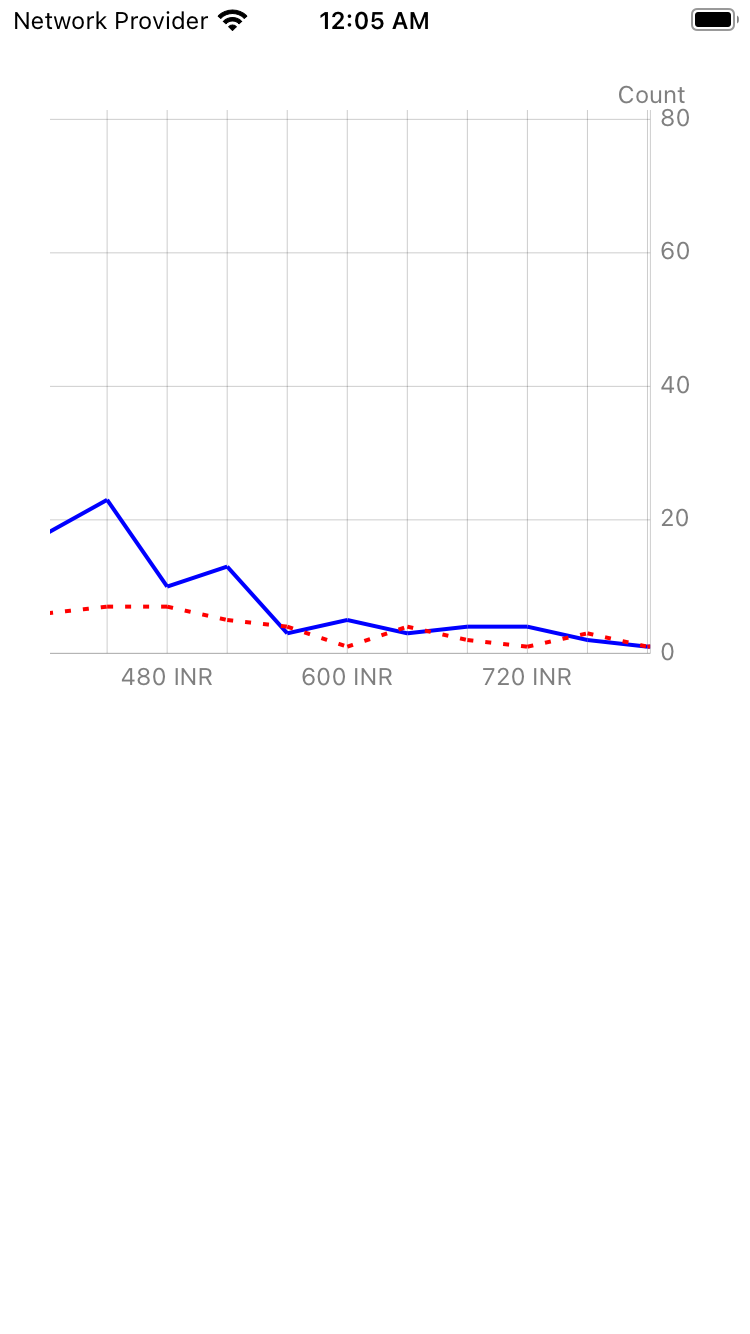
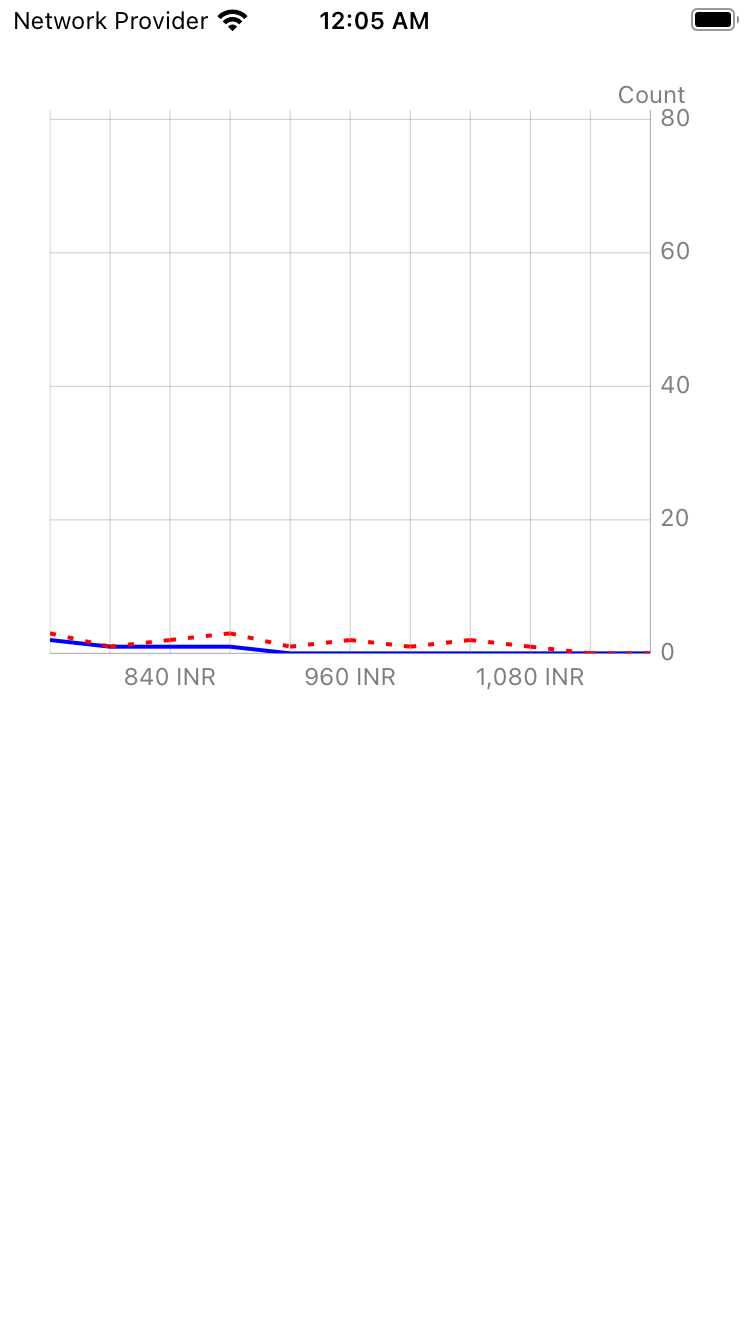
Final Result :
Let’s start by creating SomeEntity model :-
class SomeEntity {

    let count: Int
    let amount: Double
    let isPrevious:Bool

    init(count: Int, amount: Double = 0.0, isPrevious:Bool = false) {

        self.count = count
        self.amount = amount
        self.isPrevious = isPrevious
    }
}
First we need to create sample data.
extension SomeEntity {
static let sampleDataSet1 = [SomeEntity(count: 1, amount: 10),
                             SomeEntity(count: 29, amount: 1414),
                             SomeEntity(count: 36, amount: 2893),
                             SomeEntity(count: 74, amount: 7661),
                             SomeEntity(count: 37, amount: 5089),
                             SomeEntity(count: 67, amount: 11054),
                             SomeEntity(count: 45, amount: 8916),
                             SomeEntity(count: 42, amount: 9518),
                             SomeEntity(count: 38, amount: 9724),
                             SomeEntity(count: 18, amount: 5133),
                             SomeEntity(count: 18, amount: 5645),
                             SomeEntity(count: 23, amount: 7954)]

static let sampleDataSet2 = [SomeEntity(count: 0, amount: 0),
                             SomeEntity(count: 1, amount: 55),
                             SomeEntity(count: 1, amount: 84),
                             SomeEntity(count: 7, amount: 795),
                             SomeEntity(count: 8, amount: 1048),
                             SomeEntity(count: 3, amount: 485),
                             SomeEntity(count: 10, amount: 1937),
                             SomeEntity(count: 9, amount: 2040),
                             SomeEntity(count: 10, amount: 2575),
                             SomeEntity(count: 10, amount: 2866),
                             SomeEntity(count: 6, amount: 1890),
                             SomeEntity(count: 7, amount: 2424)]

}
Next we need to create a subclass of ChartDataEntry and CustomValueFormatter.
Let’s first start with LineChartDataEntry :-
class LineChartDataEntry: ChartDataEntry {

    // MARK: - Initializers

    init(xValue: Double, yValue: Double) {
        super.init(x: xValue, y: yValue)
    }

    required init() {
        fatalError("init() has not been implemented")
    }
}
Now, we create CustomValueFormatter as per our needs :-
class CustomValueFormatter: NSObject, IAxisValueFormatter {

    private let interval:Int!
    private let currency:String!

    init(interval:Int, currency:String) {
        self.interval = interval
        self.currency = currency
    }

    func stringForValue(_ value: Double, axis: AxisBase?) -> String {

        let values = Int(value)
        guard let currencyValue = currency, values >= 0 else {
            return ""
        }

        if values == 0 {
            return "0 \(currencyValue)"
        }
        else if (values % 3) == 0 { // Update as per your requirement
            let value = values * interval
            let formatter = NumberFormatter()
            formatter.numberStyle = .decimal
            formatter.minimumFractionDigits = 0
            formatter.maximumFractionDigits = 0
            formatter.roundingMode = .halfUp
            formatter.locale = Locale(identifier: Locale.current.identifier)
            formatter.multiplier = 1.0
            let formattedValue = formatter.string(for: value)!
            return "\(formattedValue) \(currencyValue)"
        }
        else {
            return ""
        }
    }
}
Next, we go to required ViewController to create and connect IBOutlets of LineChartView as well as create required Constants :-
    struct Constants {
        static let currentLineDataSetLabel = "currentLineDataSetLabel"
        static let previousLineDataSetLabel = "previousLineDataSetLabel"
        static let totalValue : Double = 1200 // Received from backend
        static let currency = "INR" // Received from backend
    }

    @IBOutlet var lineChartView: LineChartView!
Now, create setupLineChart() method to define required graph Configurations/Settings (they are self-explanatory):
    func setupLineChart() {
        // Graph Position
        lineChartView.extraLeftOffset = 25.0
        lineChartView.extraTopOffset = 15.0
        lineChartView.extraBottomOffset = 15.0
        lineChartView.extraRightOffset = 25.0

        // Graph Config
        let xAxis = lineChartView.xAxis
        let leftAxis = lineChartView.leftAxis
        let rightAxis = lineChartView.rightAxis
        rightAxis.spaceBottom = 0
        leftAxis.enabled = false
        xAxis.labelPosition = .bottom
        lineChartView.legend.enabled = false
        lineChartView.drawGridBackgroundEnabled = false

        xAxis.granularity = 1.0
        xAxis.labelCount = 10

        lineChartView.pinchZoomEnabled = false
        lineChartView.doubleTapToZoomEnabled = false

        lineChartView.backgroundColor = .white

        // Graph Chart Description
        lineChartView.chartDescription?.textColor = UIColor.black.withAlphaComponent(0.5)
        lineChartView.chartDescription?.enabled = true
        lineChartView.chartDescription?.text = "Count" // Update as per your needs
        lineChartView.chartDescription?.position = CGPoint(x: UIScreen.main.bounds.width - 32, y: 0)
        lineChartView.chartDescription?.font = UIFont.systemFont(ofSize: 12, weight: .regular)

        // Graph X Axis and Right Axis Color
        xAxis.axisLineColor = UIColor.black.withAlphaComponent(0.2)
        xAxis.gridColor = UIColor.black.withAlphaComponent(0.2)
        xAxis.labelTextColor = UIColor.black.withAlphaComponent(0.5)
        rightAxis.gridColor = UIColor.black.withAlphaComponent(0.2)
        rightAxis.axisLineColor = UIColor.black.withAlphaComponent(0.2)
        rightAxis.labelTextColor = UIColor.black.withAlphaComponent(0.5)

        // Graph X Axis and Right Axis Font
        rightAxis.labelFont = UIFont.systemFont(ofSize: 12, weight: .regular)
        xAxis.labelFont = UIFont.systemFont(ofSize: 12, weight: .regular)
    }
We need to create 2 helper method dataSetWith() to create LineChartDataSet and lineDataEntry() for creating LineChartDataEntry :
    func lineDataEntry(xValue: Double,
                           yValue: Double) -> LineChartDataEntry {
        return LineChartDataEntry(xValue: xValue, yValue: yValue)
    }

    func dataSetWith(entries: [ChartDataEntry], color: UIColor, label: String = "") -> LineChartDataSet {

        let lineChartSet = LineChartDataSet(entries: entries, label: label)
        lineChartSet.drawCirclesEnabled = false
        lineChartSet.drawValuesEnabled = false
        lineChartSet.highlightColor = .clear
        lineChartSet.drawCircleHoleEnabled = false
        lineChartSet.lineWidth = 2
        lineChartSet.fillColor = color
        lineChartSet.colors = [color]


        if label == Constants.previousLineDataSetLabel {
            lineChartSet.lineDashPhase = 0
            lineChartSet.lineDashLengths = [3, 6]
        }
        return lineChartSet

    }
Now we are ready to update Chart data based on dataSets. First we create two array’s of ChartDataEntry namely
currentLineEntries & previousLineEntries. We append values to both by looping through dataSets.
For pagination, first we need to calcuate interval which is based on totalValue i.e. value computed at
backend divided by 30 (total count of values within dataSets). Next use CustomValueFormatter with
computedInterval & currency. Finally setScaleMinima of lineChartView to 2.9 on X-axis thus enabling pagination.
After creating LineChartData from LineChartDataSet we notify ChartView of dataSet modification with lineChartView.notifyDataSetChanged():
    func setupDataSets(currency: String,
                       dataSets1: [SomeEntity],
                       dataSets2: [SomeEntity],
                       totalVal:Double,
                       showPrevious: Bool = true) {
        setupLineChart()
        var currentLineEntries = [ChartDataEntry]()
        var previousLineEntries = [ChartDataEntry]()
        for interval in 0..<dataSets1.count {
            currentLineEntries.append(lineDataEntry(xValue: Double(interval), yValue: Double(dataSets1[interval].count)))

            if showPrevious {
                previousLineEntries.append(lineDataEntry(xValue: Double(interval), yValue:Double(dataSets2[interval].count)))

            }
        }
        // Update as per your needs
        let computedInterval = (totalVal / 30).rounded(.up)
        lineChartView.xAxis.valueFormatter = CustomValueFormatter(interval: Int(computedInterval), currency: currency)
        lineChartView.setScaleMinima(2.9, scaleY: 1)
        lineChartView.scaleXEnabled = false
        lineChartView.scaleYEnabled = false

        /* Line data set */
        let currentLineDataSet = dataSetWith(entries: currentLineEntries,
                                             color: UIColor.blue,
                                             label: Constants.currentLineDataSetLabel)
        currentLineDataSet.axisDependency = .right

        if !previousLineEntries.isEmpty {
            let previousLineDataSet = dataSetWith(entries: previousLineEntries,
                                                  color: UIColor.red,
                                                  label: Constants.previousLineDataSetLabel)
            previousLineDataSet.axisDependency = .right
            var combinedData = LineChartData()
            if showPrevious {
                combinedData = LineChartData(dataSets: [currentLineDataSet, previousLineDataSet])
            }
            else {
                combinedData = LineChartData(dataSets: [currentLineDataSet])
            }
            lineChartView.data = combinedData
            lineChartView.rightAxis.labelCount = 5 // Update as per your needs
        }

        lineChartView.notifyDataSetChanged()
    }
Finally, Update viewDidLoad() method with setupDataSets() so that on intialisation itself
Line chart is first configured with required settings & then loaded with data :
       override func viewDidLoad() {
        super.viewDidLoad()
        // Do any additional setup after loading the view.
        setupDataSets(currency: Constants.currency,
                      dataSets1: SomeEntity.sampleDataSet1,
                      dataSets2: SomeEntity.sampleDataSet2,
                      totalVal: Constants.totalValue)
    }
Hope above post was informative and useful. You can check the source code on github : HERE