Multiple charts within UITableView
Before reading this post, kindly refer previous 3 posts i.e. Horizontal Bar Chart, Vertical Bar Chart & Line Chart inorder to get a clear understanding from this post.
In this post we will look into one of the practical approaches for implementing multiple charts within UITableView.
(Refer Final Result for screenshots).
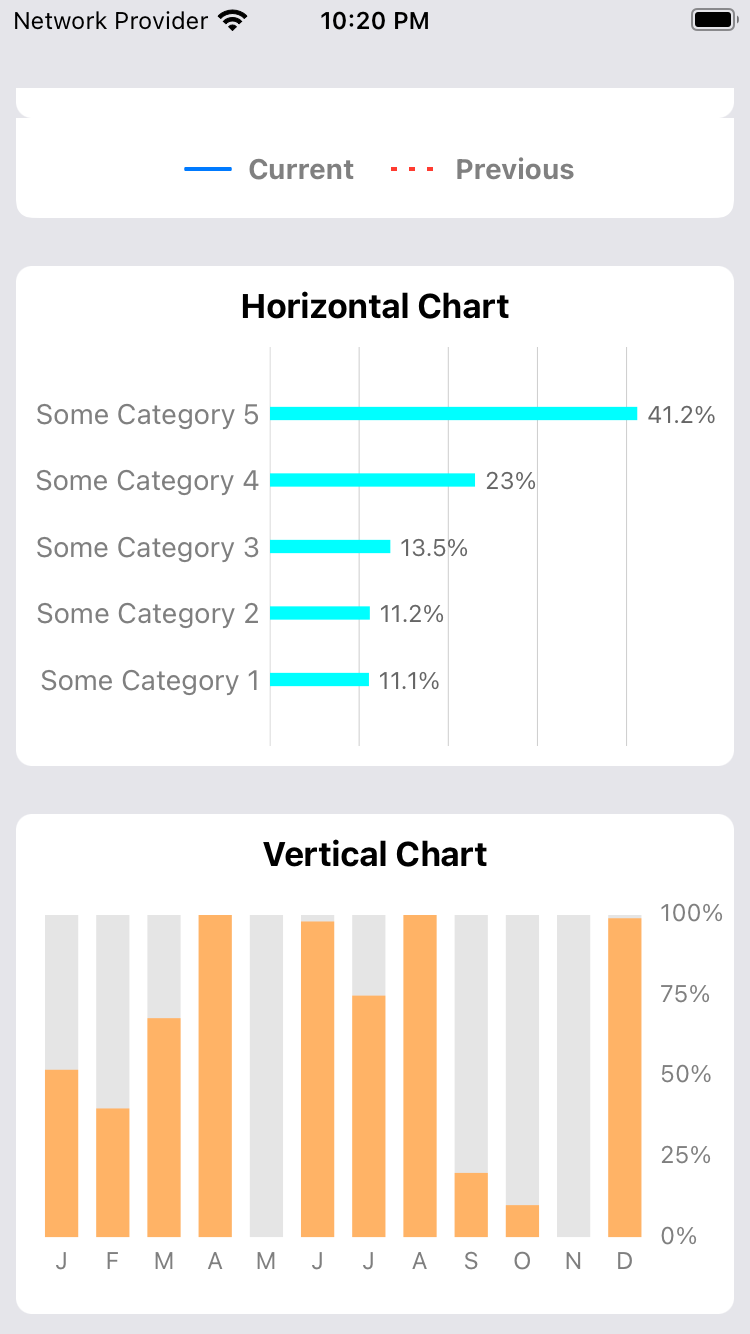
Final Result :
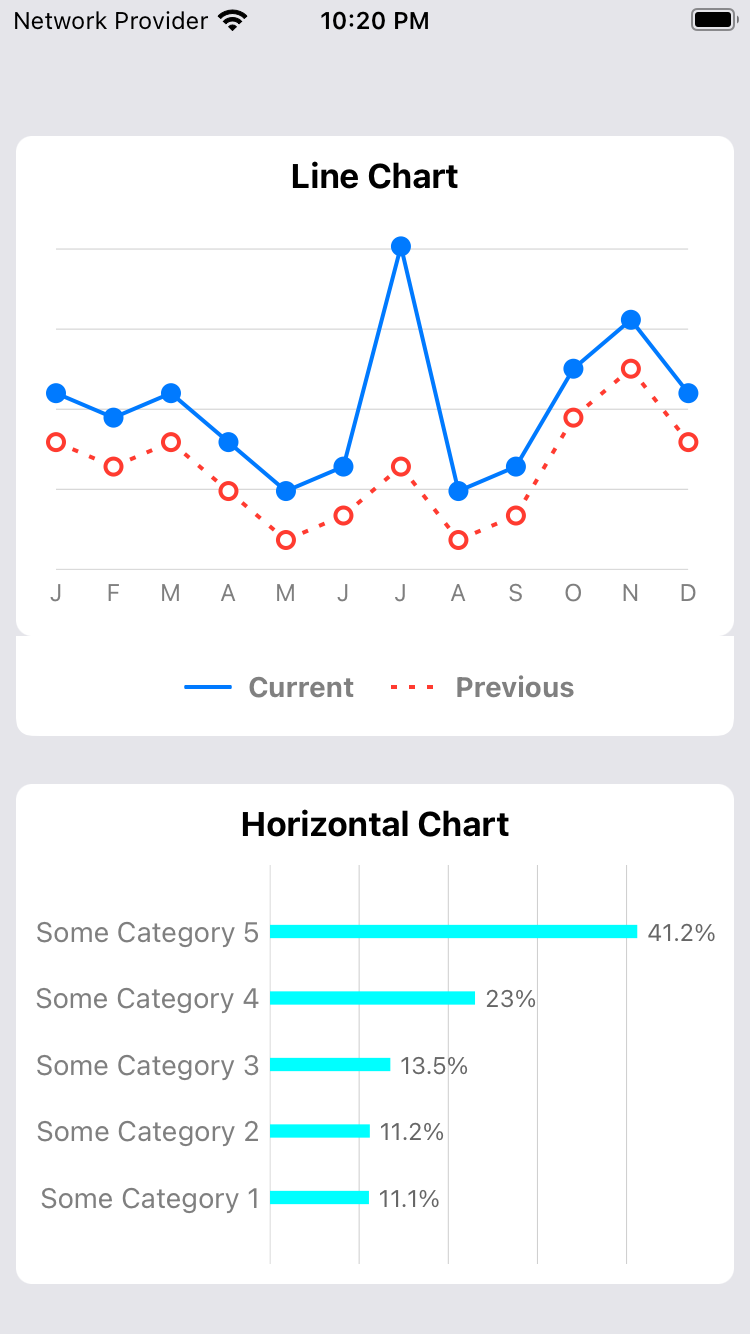
Let’s start by creating LineChartForDemo :-
import Charts
class LineChartForDemo: LineChartView {
    struct Constants {
        static let currentLineDataSetLabel = "currentLineDataSetLabel"
        static let previousLineDataSetLabel = "previousLineDataSetLabel"
    }
    let months = ["J", "F", "M", "A", "M", "J", "J", "A", "S", "O", "N", "D"]

    let arrVal1 = [15.0, 14.0, 15.0, 13.0, 11.0, 12.0, 21.0, 11.0, 12.0, 16.0, 18.0, 15.0]
    let arrVal2 = [13.0, 12.0, 13.0, 11.0, 9.0, 10.0, 12.0, 9.0, 10.0, 14.0, 16.0, 13.0]

    override init(frame: CGRect) {
        super.init(frame: frame)
        setupData()
    }

    required init?(coder aDecoder: NSCoder) {
        super.init(coder: aDecoder)
    }
    func setupLineChart() {
        // Graph Position
        extraLeftOffset = 20.0
        extraTopOffset = 5.0
        extraBottomOffset = 15.0
        extraRightOffset = 0.0

        // Graph Config
        leftAxis.enabled = false
        xAxis.labelPosition = .bottom
        rightAxis.drawZeroLineEnabled = false
        legend.enabled = false
        drawGridBackgroundEnabled = false
        xAxis.granularity = 1.0
        xAxis.labelCount = 12
        pinchZoomEnabled = false
        doubleTapToZoomEnabled = false
        rightAxis.spaceBottom = 0
        scaleXEnabled = false
        scaleYEnabled = false

        // Graph X Axis and Right Axis Color
        backgroundColor = .white
        xAxis.axisLineColor = .clear
        xAxis.gridColor = UIColor.clear
        xAxis.labelTextColor = UIColor.black.withAlphaComponent(0.5)
        rightAxis.gridColor = UIColor.black.withAlphaComponent(0.2)
        rightAxis.axisLineColor = UIColor.clear
        rightAxis.labelTextColor = UIColor.clear

        // Graph X Axis and Right Axis Font
        rightAxis.labelFont = UIFont.systemFont(ofSize: 12, weight: .regular)
        xAxis.labelFont = UIFont.systemFont(ofSize: 12, weight: .regular)
    }

    func lineDataEntry(xValue: Double,
                       yValue: Double) -> LineChartDataEntry {
        return LineChartDataEntry(xValue: xValue, yValue: yValue)
    }

    func setupData(showPrevious: Bool = true) {
        setupLineChart()
        var currentLineEntries = [ChartDataEntry]()
        var previousLineEntries = [ChartDataEntry]()
        for interval in 0..<months.count {
            currentLineEntries.append(lineDataEntry(xValue: Double(interval), yValue: Double(arrVal1[interval])))

            if showPrevious {
                previousLineEntries.append(lineDataEntry(xValue: Double(interval), yValue:Double(arrVal2[interval])))

            }
        }
        xAxis.valueFormatter = IndexAxisValueFormatter(values: months)

        /* Line data set */
        let currentLineDataSet = dataSetWith(entries: currentLineEntries,
                                             color: UIColor.systemBlue,
                                             label: Constants.currentLineDataSetLabel)

        if !previousLineEntries.isEmpty {
            let previousLineDataSet = dataSetWith(entries: previousLineEntries,
                                                  color: UIColor.systemRed,
                                                  label: Constants.previousLineDataSetLabel)
            var combinedData = LineChartData()
            if showPrevious {
                combinedData = LineChartData(dataSets: [currentLineDataSet, previousLineDataSet])
            }
            else {
                combinedData = LineChartData(dataSets: [currentLineDataSet])
            }
            data = combinedData
            rightAxis.labelCount = 5 // Update as per your needs
        }
        notifyDataSetChanged()
    }
Next we will create VerticalChartForDemo :-
import Charts
class VerticalChartForDemo: BarChartView {

    let months = ["J","F","M","A","M","J","J","A","S","O","N","D"]
    let percentages = [52.0, 40.0, 68.0, 100.0, 0.0, 98.0, 75.0, 100.0, 20.0, 10.0, 0.0, 99.0]

    override init(frame: CGRect) {
        super.init(frame: frame)
        setupData()
    }

    required init?(coder aDecoder: NSCoder) {
        super.init(coder: aDecoder)
    }
    func setupVerticalChart() {
        // Graph Position
        extraLeftOffset = 0
        extraTopOffset = 20
        extraBottomOffset = 20
        extraRightOffset = 0

        leftAxis.enabled = false
        xAxis.labelPosition = .bottom
        legend.enabled = false
        drawGridBackgroundEnabled = false
        xAxis.granularity = 1.0
        xAxis.labelCount = 12

        pinchZoomEnabled = false
        doubleTapToZoomEnabled = false

        backgroundColor = .white

        // Graph X Axis and Right Axis Color
        xAxis.axisLineColor = .clear
        xAxis.gridColor = .clear
        xAxis.labelTextColor = UIColor.black.withAlphaComponent(0.5)
        rightAxis.gridColor = .clear
        rightAxis.axisLineColor = .clear
        rightAxis.labelTextColor = UIColor.black.withAlphaComponent(0.5)

        // Graph X Axis and Right Axis Font
        rightAxis.labelFont = UIFont.systemFont(ofSize: 12)
        xAxis.labelFont = UIFont.systemFont(ofSize: 12)

        rightAxis.drawZeroLineEnabled = false
        rightAxis.drawAxisLineEnabled = false
    }


    func setupData() {
        setupVerticalChart()
        var barEntries = [BarChartDataEntry]()

        for interval in 0..<months.count {
            let val1 = Double(percentages[interval])
            let val2 = 100 - val1
            barEntries.append(BarChartDataEntry(x:  Double(interval), yValues: [val1, val2]))
        }

        let barDataSet = dataSetWith(entries: barEntries,
                                     colors: [UIColor.orange.withAlphaComponent(0.6), UIColor.black.withAlphaComponent(0.1)],
                                     highlightColor: UIColor.orange.withAlphaComponent(1.0),
                                     label: "label")

        xAxis.valueFormatter = IndexAxisValueFormatter(values: months)
        setupRightAxisFormatter()

        let barData = BarChartData(dataSet: barDataSet)
        barData.barWidth = 0.65
        data = barData
        barDataSet.axisDependency = .right

        notifyDataSetChanged()
    }
    func setupRightAxisFormatter() {
        let rightAxisFormatter = NumberFormatter()
        rightAxisFormatter.positiveSuffix = "%"
        rightAxis.valueFormatter = DefaultAxisValueFormatter(formatter: rightAxisFormatter)
        rightAxis.axisMinimum = 0
        rightAxis.axisMaximum = 100
        rightAxis.granularity = 25
    }
    func dataSetWith(entries: [BarChartDataEntry],
                     colors: [UIColor] = [.black],
                     highlightColor: UIColor,
                     label: String = "") -> BarChartDataSet {

        let barDataSet = BarChartDataSet(entries: entries, label: label)
        barDataSet.drawIconsEnabled = false
        barDataSet.drawValuesEnabled = false
        barDataSet.colors = colors
        barDataSet.highlightColor = highlightColor
        barDataSet.highlightAlpha = 1.0
        barDataSet.highlightLineWidth = 0

        return barDataSet
    }
}
Lastly we will create HorizontalBarChartView:-
import Charts

class HorizontalChartDemo: HorizontalBarChartView {

    let unitsSold = [11.1, 11.2, 13.5, 23.0, 41.2]
    let singleLineCategory = ["Some Category 1", "Some Category 2", "Some Category 3", "Some Category 4", "Some Category 5"]

    override init(frame: CGRect) {
        super.init(frame: frame)
        setupData()
    }

    required init?(coder aDecoder: NSCoder) {
        super.init(coder: aDecoder)
    }

    func setupGraphSettings() {
        extraLeftOffset = 0.0
        extraTopOffset = 0.0
        extraBottomOffset = 0.0
        extraRightOffset = 30.0

        pinchZoomEnabled = false
        doubleTapToZoomEnabled = false
        scaleXEnabled = false
        scaleYEnabled = false

        // Graph Config
        legend.enabled = false
        xAxis.enabled = true
        xAxis.labelPosition = .bottom
        xAxis.drawAxisLineEnabled = false
        xAxis.drawGridLinesEnabled = false
        xAxis.drawLabelsEnabled = true

        xAxis.axisMinimum = -1
        xAxis.axisMaximum = 5
        xAxis.granularityEnabled = true
        xAxis.granularity = 1

        leftAxis.enabled = true
        leftAxis.drawLabelsEnabled = false
        leftAxis.axisMinimum = 0

        rightAxis.enabled = false

        // Graph Color & Font settings
        backgroundColor = .white
        leftAxis.zeroLineColor = UIColor.clear
        leftAxis.axisLineColor = UIColor.clear
        leftAxis.gridColor = UIColor.black.withAlphaComponent(0.2)
        xAxis.labelFont = UIFont.systemFont(ofSize: 14)
        xAxis.labelTextColor = UIColor.black.withAlphaComponent(0.5)

    }
    func dataSetWith(entries: [BarChartDataEntry],
                     colors: [UIColor] = [.black],
                     highlightColor: UIColor,
                     label: String = "") -> BarChartDataSet {

        let barDataSet = BarChartDataSet(entries: entries, label: label)
        barDataSet.valueFont = UIFont.systemFont(ofSize: 14)
        barDataSet.drawValuesEnabled = true
        barDataSet.colors = colors
        barDataSet.highlightColor = highlightColor

        return barDataSet
    }

    func setupData() {
        setupGraphSettings()
        xAxis.valueFormatter = IndexAxisValueFormatter(values: singleLineCategory)

        var arrEntries = [BarChartDataEntry]()

        for interval in 0..<unitsSold.count {
            arrEntries.append(BarChartDataEntry(x: Double(interval), y: Double(unitsSold[interval])))
        }

        let arrarDataSet = dataSetWith(entries: arrEntries,
                                       colors: [UIColor.cyan],
                                       highlightColor: UIColor.black,
                                       label: "label1")

        let barData = BarChartData(dataSet: arrarDataSet)
        setupPercentValueFormatter(barData: barData)
        barData.barWidth = 0.2
        data = barData

        data?.notifyDataChanged()
    }

    func setupPercentValueFormatter(barData : BarChartData) {
        let percentAxisFormatter = NumberFormatter()
        percentAxisFormatter.numberStyle = .decimal
        percentAxisFormatter.positiveSuffix  = "%"
        percentAxisFormatter.maximumFractionDigits = 2
        barData.setValueFormatter(DefaultValueFormatter(formatter: percentAxisFormatter))

        barData.setValueFont(UIFont.systemFont(ofSize: 12))
        barData.setValueTextColor(UIColor.black.withAlphaComponent(0.6))
    }
}
Now we are ready to create DemoChartFactory :-
enum DemoChartFactory:Int {
    case line
    case horizontal
    case vertical

    var title:String {
        switch self {
        case .line:
            return "Line Chart"
        case .horizontal:
            return "Horizontal Chart"
        case .vertical:
            return "Vertical Chart"
        }
    }

    var chartView:UIView {
        switch self {
        case .line:
            return LineChartForDemo()
        case .horizontal:
            return HorizontalChartDemo()
        case .vertical:
            return VerticalChartForDemo()
        }
    }
    static let count: Int = {
        var max: Int = 0
        while let _ = DemoChartFactory(rawValue: max) { max += 1 }

        return max
    }()
}
Next, create required TableViewCell :-
import UIKit

class TableViewCell: UITableViewCell {
    @IBOutlet weak var chartViewContainer : UIView!
    @IBOutlet weak var lblTitle : UILabel!
    var factory: DemoChartFactory?
    override func awakeFromNib() {
        super.awakeFromNib()
        // Initialization code
        self.layer.cornerRadius = 8.0
        self.clipsToBounds = true
    }

    override func setSelected(_ selected: Bool, animated: Bool) {
        super.setSelected(selected, animated: animated)
        // Configure the view for the selected state
    }
}
Now, go to required ViewController to register TableViewCell & setup UITableViewDataSource methods :
class ViewController: UIViewController {

    @IBOutlet weak var tableView:UITableView!

    override func viewDidLoad() {
        super.viewDidLoad()
        // Do any additional setup after loading the view.
        tableView.register(UINib(nibName: "TableViewCell", bundle: nil), forCellReuseIdentifier: "Cell")
    }
}

extension ViewController : UITableViewDataSource {

    func numberOfSections(in tableView: UITableView) -> Int { DemoChartFactory.count }
    func tableView(_ tableView: UITableView, numberOfRowsInSection section: Int) -> Int { 1 }
    func tableView(_ tableView: UITableView, cellForRowAt indexPath: IndexPath) -> UITableViewCell {
        guard let cell = tableView.dequeueReusableCell(withIdentifier: "Cell") as? TableViewCell else {
            return UITableViewCell()
        }
        return configureCell(indexPath.section, cell: cell)
    }
    func configureCell(_ index:Int, cell:TableViewCell) -> UITableViewCell {
        cell.factory = DemoChartFactory(rawValue: index)
        return cell
    }
}
Hope above post was informative and useful.